
The Lucent360â„¢ LED modules and vial holders/reactors are fully interchangeable, offering users the freedom to tailor their experiments to meet specific needs. With adjustable wavelength, light intensity, vial arrangement, and temperature control, the possibilities for customization are virtually limitless. The Lucent360â„¢ enables researchers to swiftly explore reaction parameters required for scaling up processes at smaller scales, ensuring consistency when transitioning to larger-scale production using the same equipment.
A great example of the versatility provided by the Lucent360â„¢ is illustrated in the following reaction light intensity and catalyst screening for an iridium-catalyzed C-C bond formation (see Figure 1).
Figure 1:
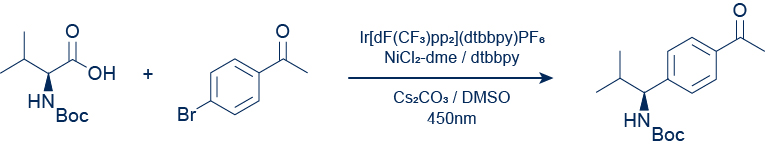
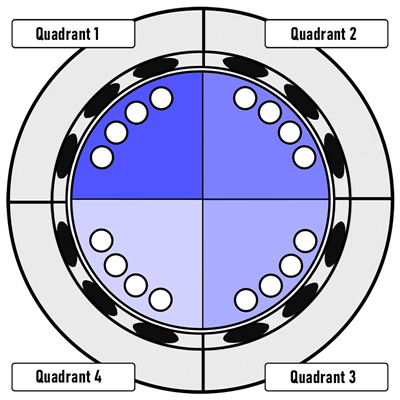
Using the Lucent 360™ multi-light screener (HCK1021-01-010), which is capable of screening 16 reactions simultaneously across four different wavelengths and light intensities, the following reaction screen was conducted at 450 nm. Four iridium catalyst concentrations (1 mol %, 0.5 mol %, 0.1 mol %, 0.01 mol %) were tested with four varying light intensities on the Lucent360™. Based on actinometry experiments performed in 2 ml reactions, each setting corresponds to running the reactions at 0.25 W, 0.54 W, 1.05 W, and 1.2 W effective power. These effective powers translate to photon flux ranging from 9.5×10⁻⁷ to 4.5×10⁻⁶ Einstein/s (moles photons/second).
| Effective Power/Reaction (W) |
(+/-) | Photon Flux (Einstein/s) | |
| Quadrant 1 | 1.21 | 8.4% | 4.54E-06 |
| Quadrant 2 | 1.05 | 8.3% | 3.94E-06 |
| Quadrant 3 | 0.54 | 6.0% | 2.03E-06 |
| Quadrant 4 | 0.25 | 4.1% | 9.50E-07 |
Â
| Effective Power/ Reaction (W) |
(+/-) | Photon Flux (Einstein/s) | |
| Quadrant 1 | 1.21 | 8.4% | 4.54E-06 |
| Quadrant 2 | 1.05 | 8.3% | 3.94E-06 |
| Quadrant 3 | 0.54 | 6.0% | 2.03E-06 |
| Quadrant 4 | 0.25 | 4.1% | 9.50E-07 |
The multi-light intensity/catalyst screen was carried out according to the following protocol (Table 1):
To each 4 ml vial equipped with a Teflon septa and stir bar, a solution containing 1.1 mg Ni-glyme (5 mol %, 5 µmol) and 1.3 mg dtbbpy (5 mol %, 5 µmol) in methanol was added, and the solvent was removed under reduced pressure (16 vials). To the resulting vial, 48.9 mg Cs2CO3 (1.5 equiv., 150 µmol) was weighed under inert atmosphere and capped. To this vial, a 1 ml sparged solution in DMSO containing 19.9 mg bromoacetophenone (100 µmol), 35.6 mg Boc-Val-OH (1.5 equiv., 150 µmol), and 7.7 mg biphenyl (0.5 equiv., 50 µmol) as an internal standard was added. Ir(dF-CF3-ppy)2(dtbbpy) was added as a solution in DMSO to afford 0.01, 0.1, 0.5, or 1 mol % catalyst. Additional DMSO was added to each reaction to bring the total reaction volume to 2.0 mL DMSO. The reaction was performed at 30 °C in the Lucent360™ with 450 nm LED. Analytical samples were taken from each vial at 5, 15, 30, and 60 minutes for analysis by LC-MS (10 µL diluted to 1 mL in DMSO).
Â
Table 1 : Experimental Details (for standard conditions)
| Reagent | Equivalent | Amount (µmol) | 0.05 | M |
| bromoacetophenone | 1 | 100 | 19.9 | mg |
| boc-Val-OH | 1.5 | 150 | 32.6 | mg |
| Ir(dF-CF3-ppy)2(dtbbpy) | 0.01 | 1 | 1.1 | mg |
| Ni-glyme | 0.05 | 5 | 1.1 | mg |
| dtbbpyp | 0.05 | 5 | 1.3 | mg |
| Cs2CO3 | 1.5 | 150 | 48.9 | mg |
| Biphenyl | 0.5 | 50 | 7.7 | mg |
| Solvent | DMSO | 0.05M | 0.002 | L |
Monitoring the reaction screen over a period of 1 hour revealed clear trends in product formation related to catalyst concentration and light intensity (Table 2). Each reaction with 1 mol % Ir catalyst achieved similar conversions (62-65%) at 60 minutes, irrespective of the power setting. With 0.5 mol % catalyst, 0.54 W or higher was sufficient to achieve comparable conversions. Lower catalyst loadings had adverse effects on conversion, regardless of the power setting.
Â
Table 2 : Conversion at 60 minutes
| Power (%) | ||||
| Ir cat (mol%) | 0.25W | 0.54W | 1.05W | 1.21W |
| 1 | 62.0 | 63.5 | 65.6 | 65.2 |
| 0.5 | 47.8 | 65.1 | 67.7 | 65.8 |
| 0.1 | 15.7 | 33.7 | 45.2 | 47.7 |
| 0.01 | 1.0 | 0.2 | 2.6 | 2.6 |
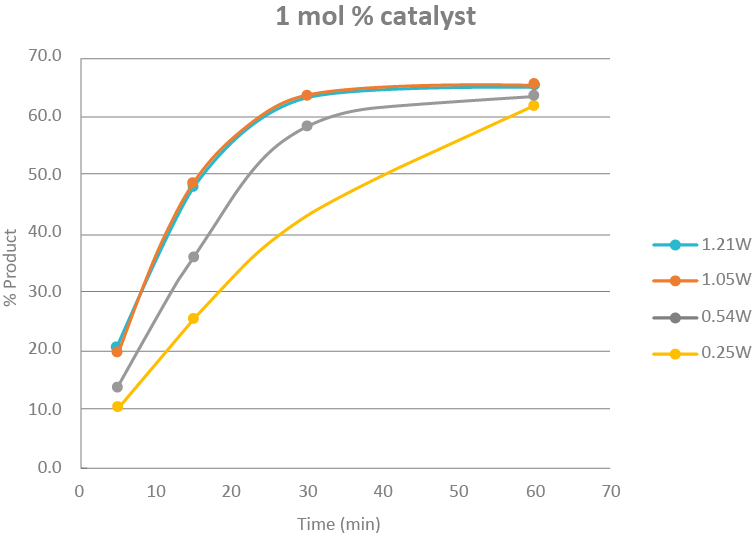
While the final conversion is similar for the seven conditions highlighted in green in Table 2, significant differences were noted in the initial rates and time to reaction completion (Figure 3). Reactions at 1.0 W and 1.2 W are completed by 30 minutes with minimal further product formation, whereas the two lower power settings require the full 60 minutes for completion.
Â
Figure 3: Time course plot for 1 mol % at 0.25W, 0.54W, 1.05W, and 1.21W
Based on these findings, the reaction can be performed with 0.5 mol % photocatalyst and 0.54 W to achieve similar conversions to those obtained with higher catalyst loadings and light intensities (Figure 4), although the reaction proceeds at a slower pace.
Â
Figure 4: Time course plot for 0.54 W setting with 4 catalyst concentrations
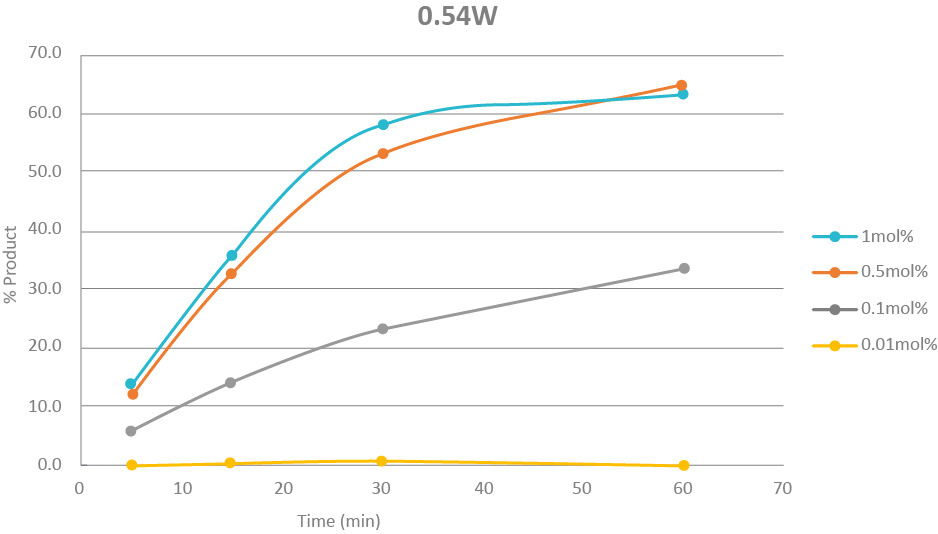
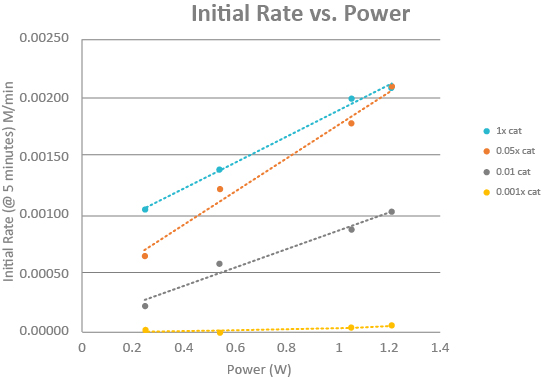
Monitoring the initial rate of the reaction at 5 minutes reveals the significant impact of light intensity on the reaction. Enhancing the initial rate of the reaction is a critical factor in determining the appropriate conditions for scaling up a photochemical reaction. What does this all mean for this C-C bond formation reaction? We’re not entirely certain yet, but we do know that without the straightforward setup of the Lucent360™ and the capability to monitor multiple light intensities simultaneously, it would have taken us much longer to gather all this data. Perhaps for our next experiment using this reaction, we could examine four different concentrations of the nickel co-catalyst at each light intensity compared to the 0.5 mol % iridium catalyst, or screen additional wavelengths (365 nm, 380 nm, 405 nm) or vary the substrate concentrations. Whatever we decide, we’re confident that it will be simple to execute with the Lucent360™.
Â
Figure 5 :
Â
Learn More:
- Contact us: [insert contact information here]
- Access the Lucent360â„¢ directly from Hepatochem on our website.
- Follow our updates on LinkedIn.
We are a professional OEM/ODM manufactuers in china,we customzie product for our customers according to our customers request
we can customzie Jelly Stick According to customers request for it.like Jelly Stick and Suck Suck Jelly with Bag
10g/15g/20g/25g etc per sachet for the Jelly Stick,this kinds moq is 30000sachet for it
100g/150g/200g etc per bag for Suck Jelly,this kinds moq is 30000bag for it
Guangzhou Green Health Pharmaceutical Technology Co., Ltd. commited to build health and beauty,it is a High-tech intergreted enterprise company include research developing,manufacturing,market sale and OEM. We focus on product research,development and utilize scientific research industry since the company established.The company brings together the technical elites of biological research institutes and colleges and universities. In terms of product development and research, it is among the best in the industry in terms of raw materials, formulas and technologies.Relying on strong technical strength and professionalism, we are a gold medal partner for various e-commerce and TV shopping."Excellent quality, competitive price, efficient service" is our slogan to undertake commissioned processing, to help you win in the fierce market competition.We mainly engaged in the business scope of solid beverages, tablets, gummies, capsules, enzyme jelly, Oral Liquid and other new products development, production, packaging, sales and OEM one-stop service. Guangzhou Green Health Pharmaceutical Technology Co., Ltd.,strength and product quality have been recognized by the industry.We welcome friends from all walks of life come to visit, guide and negotiate business.
Vitamin Jelly,Weight Loss Jelly,Skin Whitening Jelly,Collagen Jelly
Guangzhou Green health Pharmaceutical Technology Co.,Ltd , https://www.greenhealthfactory.com